Ocean Chemicals Lab:
The lab's purpose is to understand the elements below:
- Sequence of the scientific method.
- Key vocabulary such as dependent variable, independent variable, subjects, test group, and control group.
- Structure of a lab report.
- Calculating and graphing data.
- Experimental Design.
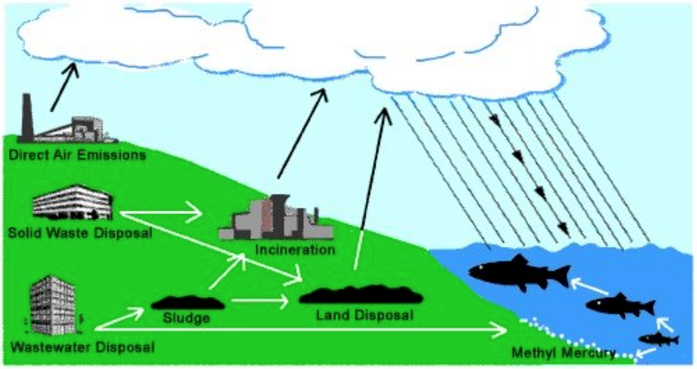
- How human pollution/chemicals in the ocean are affecting plants and/or animals.
Part 1 Instructions:
Day 1:
- Grab tray with the cup/beaker labeled with your station #.
- Label test tubes 0%, 0.25%, and 0.5%. Write directly on the test tube only with a SHARPIE (any other ink will rub off). I will reuse the test tubes next year so please do not throw away at the end of the experiment :)
- Add 50 plant seeds to each tube. Be sure to add seeds to test tubes before adding the solutions.
- Add 10 mls of 0% caffeine solution to test tube labeled 0%. Lightly tap test tube on table to sink any floating seeds. You want each seed fully submerged in liquid.
- Add 10 mls of 0.25% caffeine solution to test tube labeled 0.25%. Lightly tap test tube on table to sink any floating seeds. You want each seed fully submerged in liquid.
- Add 10 mls of 0.5% caffeine solution to test tube labeled 0.5%. Lightly tap test tube on table to sink any floating seeds. You want each seed fully submerged in liquid.
- Place the blue tape labeled with your station number located on the beaker/cup holding your test tubes. Then place your test tubes with the seeds inside so they are sitting upright.
- Place beaker in period-specific shelf in cabinet to allow the seeds to soak in caffeine solutions overnight (24 hours) in the dark (I will shut the cupboard doors).
- Place sharpee and seeds back in bin and place bin on table.
- Obtain 3 petri dishes and label each one 0%, 0.25%, and 0.5% (if they haven't already been labeled for you).
- Build filters in each petri dish (Mrs. Wilson will provide detailed instructions).
- Drain 0% seeds on the filter in petri dish labeled 0%. Space seeds apart so they are not touching.
- Drain 0.25% seeds on the filter in petri dish labeled 0.25%. Space seeds apart so they are not touching.
- Drain 0.5% seeds on the filter in petri dish labeled 0.5%. Space seeds apart so they are not touching.
- Stack the three petri dishes. Remove the blue tape (with your station number) from the beaker/cup and place on the top petri dish. Place stack back in cabinet to sit overnight (24 hours).
- Rinse test tubes to dry.
- Place all materials, including cups, back in bin and set on table.
- If you haven't already done so, read the background paragraph on hand out and answer questions #1-2. Be sure to answer all the bullets in question #2. Also, write the question that you will be answering during this experiment. Hint: In this investigation, you will be testing to see what effect caffeine has on seed germination. After you finish writing the question, write a hypothesis. Hint: What do you think will be the answer to your question? Do not write in the first person!
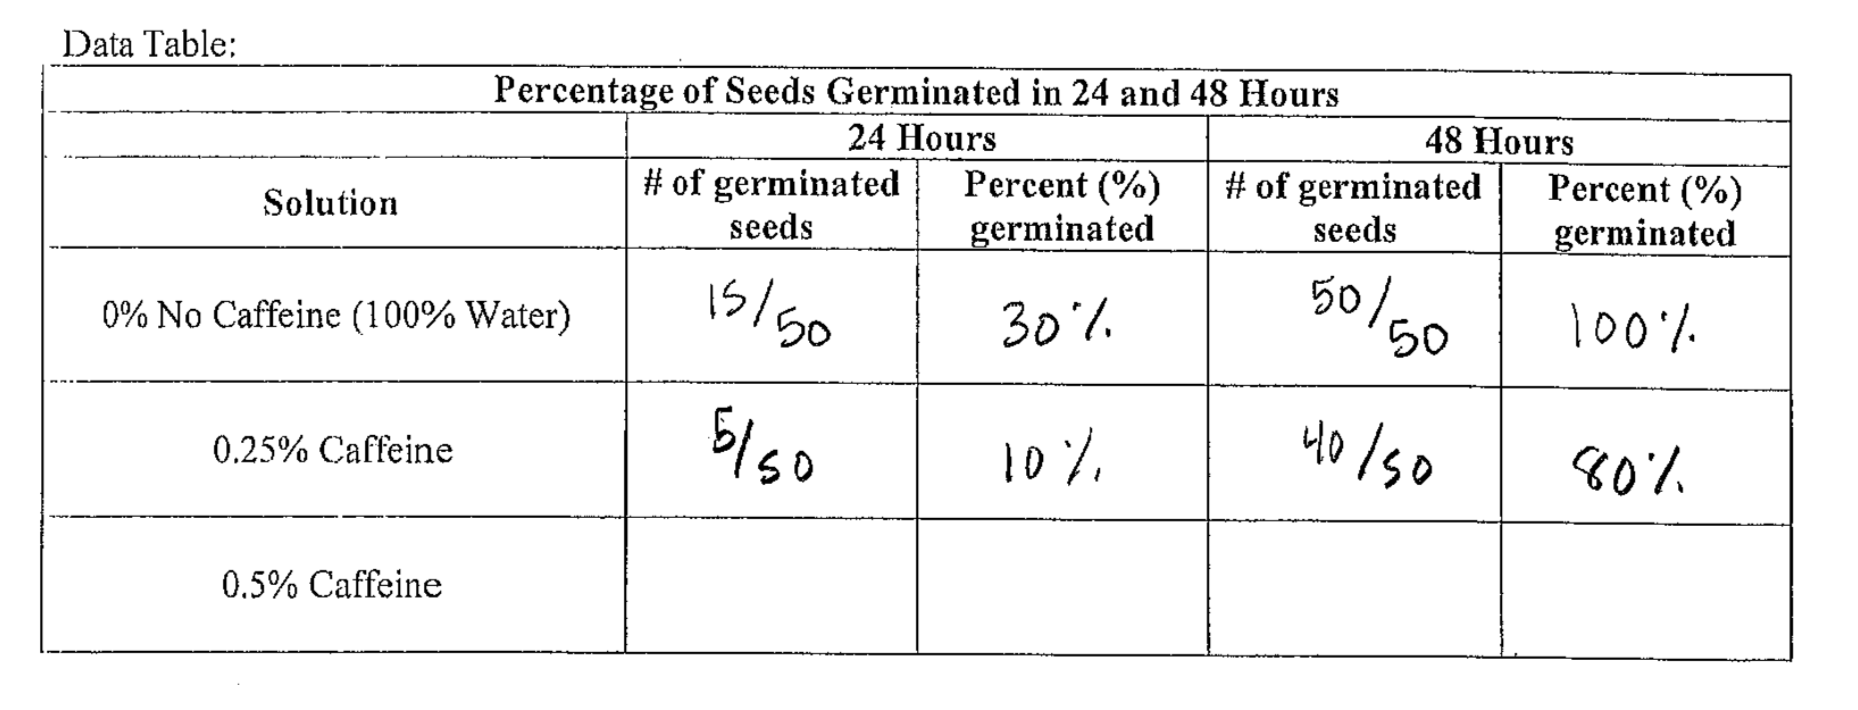
- Count number of seeds that have germinated out of 50 for each condition. Document data in data table and calculate percent of seeds that have germinated. Do not use phones, a calculator is provided at each station. To calculate the percent of seeds that have germinated, divide the number of seeds germinated by 50 and then multiply by 100. For example, if 30/50 seeds germinated, this would mean that 60% of the seeds germinated
- Stack petri dishes once again. Be sure your group's labeled tape is placed on top of the stack. Place stack back in cabinet to sit overnight for another 24 hours (48 hours total).
- Count number of seeds that have germinated out of 50 for each condition. Document data in data table and calculate percent of seeds that have germinated. Do not use phones, a calculator is provided at each station. To calculate the percent of seeds that have germinated, divide the number of seeds germinated by 50 and then multiply by 100. For example, if 30/50 seeds germinated, this would mean that 60% of the seeds germinated.
- Clean-up: SAVE petri dishes, but throw away contents in petri dishes (filter and seeds) in garbage can. Rinse petri dishes and stack to dry.
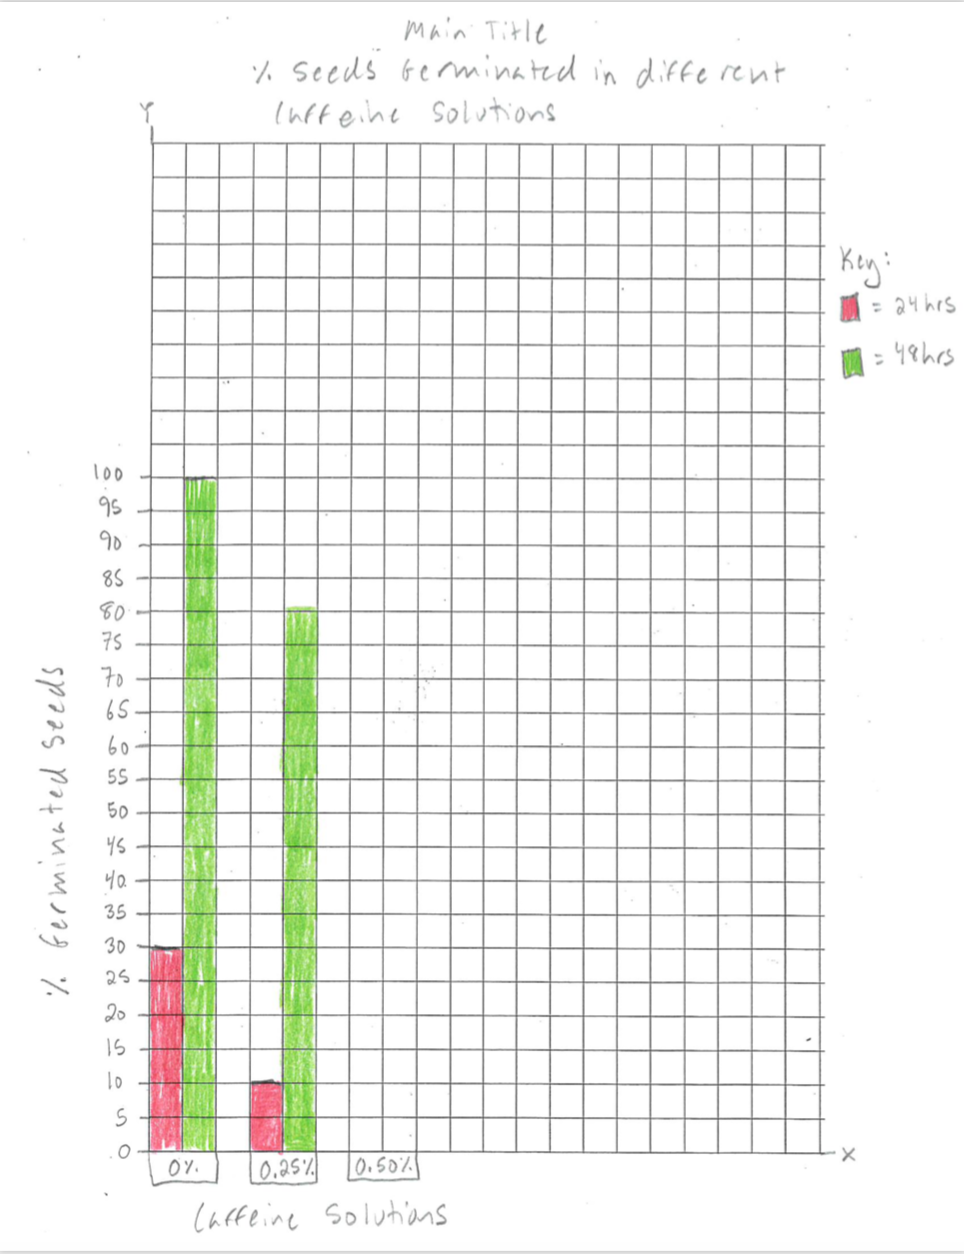
Graphing Instructions:
Let's PRETEND you collected the data below (DO NOT COPY you have your own TRUE DATA).
- Use the example here to set up your graph.
- Do not shade in the same percentages because it reflects the pretend data. You will shade in the percentages you collected during the experiment.
- Include Titles (x, y, and main titles)
- Include Numbers on y-axis
- Include Caffeine solution concentrations on x-axis
- Include Key (Use one color for 24 hours and another color for 48 hours). MUST BE IN COLOR!
Conclusion Instructions:
- On a separate piece of paper, write a conclusion and staple to the ba
- Discuss general trends in data/results. Hint: What did the data show?
- Discuss whether you accept or reject your hypothesis based on these trends.
- Identify at least 2 possible sources of human error (what could you have done wrong that would lead to inaccurate results).
Part 2 Instructions:
See below for your table team's assigned chemical pollutant:
Table 1: Oil (from oil spills/leaks)
Table 2: Sunscreen (from beach use)
Table 3: Excess Salt (from desalinization)
Table 4: Fertilizer runoff (from farming)
Table 5: Oil (from oil spills/leaks)
Table 6: Sunscreen (from beach use)
Table 7: Excess Salt (from desalinization)
Table 8: Fertilizer runoff (from farming)
Table 9: Excess CO2 in ocean causing ocean to be more acidic (from global warming) Hint: In this case, test an acid to mimic CO2
In this part of the lab, you and your team will design the procedure of a controlled experiment that tests your assigned ocean chemical on mustard seeds. You will use the foundation of the caffeine lab to help you with your design. The goal is to develop a step-by-step user friendly procedure that most people could follow and implement without confusion and error. Your procedure should be descriptive like a cookie recipe :)!!! You will need the components below in your report:
- Just like the caffeine lab, you should vary the concentrations of your pollutant and include a control! You will need to describe how to make the varying concentrations of your pollutant. How much volume or weight will you use of the pollutant? What and how much are you going to dilute your pollutant with?
- Describe why the experiment is considered controlled.
- You will also need to be VERY specific about the quantities of the materials and equipment needed and list any safety hazards (come up with at least 2) that may be encountered during the lab. Hint: Are you dealing with any dangerous equipment (e.g. hot plates) or toxic chemicals?
- Construct data tables that will be filled in during the lab and identify the quantitative and qualitative data that will be collected.
- Design the graph (types of graph and titles) you will use to display the data once collected.
- Your team must also identify the independent variable, dependent variable, test subjects species, control group, and test group and explain how/why your experiment is a "controlled" experiment (Hint: Identify that your experiment has a control group and list the variables that are the same and different between the control and test group).
- Before you begin your design, research how your chemical pollutant is affecting plants and/or animals in the ocean. Also explain how human activity is causing your pollutant to end up in the ocean. Be descriptive!
