Earth's Layers Project:
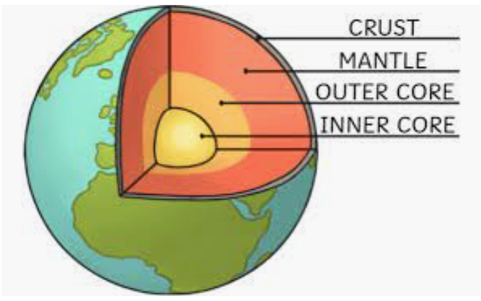
Part A: Earth's geosphere is made of three layers, the core (inner and outer), mantle, and crust. See picture above! The geosphere oriented itself this way due to density differentiation (aka density stratification). Basically the most dense materials sank to the center to form the core and the less dense material rose to form the mantle and crust. Remember that when Earth formed, it was incredibly hot with all the collisions from planetismals (big rocks) that formed our planet. As a result, all rock that first formed Earth was melted due to the high temperatures. Melted rock can also be referred to as molten rock! Today the mantle is still so hot that all the rock that exists within it is still in molten form. The temperatures on Earth's surface have cooled over the years allowing all of Earth's crust to solidify into solid rock. For this reason, the crust is solid rock, which "floats" on the mantle. Read the Density Layering section in this article (click here) and answer the questions below.
1. What material formed Earth's core?
2. What material formed the mantle?
3. What material formed the crust?
4. What happened to the molten rock that formed Earth's crust as Earth cooled over time? Did it still exist in molten form?
5. What did volcanic eruptions bring to the surface of Earth?
6. What formed from water vapor when Earth's surface cooled enough?
7. What increases continental mass?
8. What decreases continental mass?
9. Explain how continents float on the mantle when mass increase and decreases.
10. Describe the consistency of the mantle.
Part B: In this part, you will draw the thickness of each Earth layer to a scale that will fit on a sheet of printer paper. This way you can see how big each layer is relative to one another. To perform this part, follow the instructions (click here). Both Table 7.1 C is and an area to identify your appropriate diagram distance scale are located in your performance task. Based on the actual thickness of each layer, you will need to determine what scale will fit on your sheet of paper. Also included in the performance task is a box to upload a picture of your completed diagram. Shrink picture down to a reasonable size once uploaded. After finishing with the diagram, answer the questions below:
1. How did you calculate the radii for Step 3?
2. If you had used a larger piece of paper, how would your distance scale have changed?
3. How does scale affect your interpretation of the data?
4. What happens to density of the materials in he Earth as depth increases?
5. How does the density of each layer affect its location with response to other layers?
6. What are the limitations of your model of the Earth? How could you improve it?
7. What would you need to do to incorporate the depth of the ocean in your model?
Part 3: In this part, you will learn about the different features found on Earth's crust. On a sheet of paper, copy the picture below and then label A-J with the name of the ocean feature. Review the ocean bottom reading (click here) that we already completed and also use this Google Slides PowerPoint to help you figure out each feature. Please do additional research on your own if you're still confused about certain features. Once finished, take photo of work and upload in performance task.
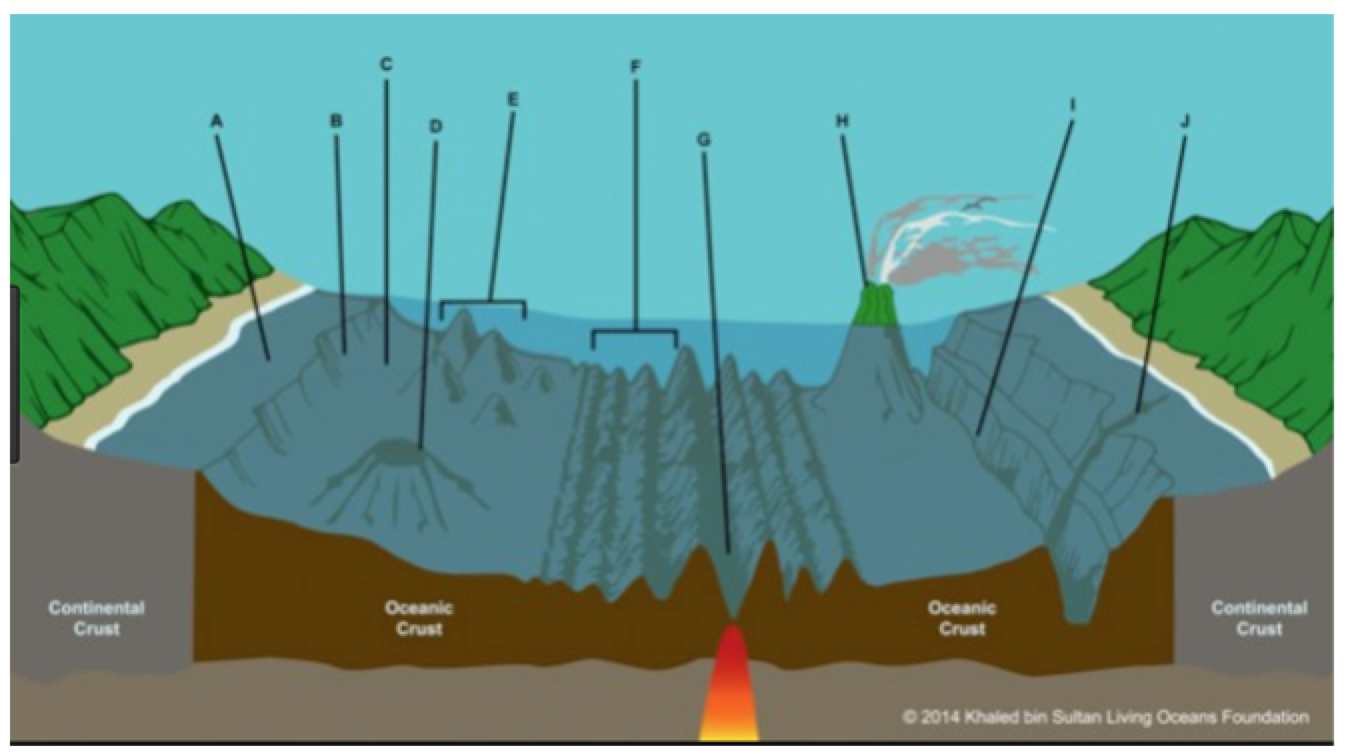
Instructions: On a sheet of paper, copy the picture above and then label A-J with the name of the ocean feature. Review the ocean bottom reading (click here) that we did yesterday and also use this Google Slides PowerPoint to help you figure out each feature. Please do additional research on your own if you're still confused about certain features. Don't forget to put your name (first and last) in the top right corner. Take photo of your work and upload picture in correct space in performance task.
