Nancy Foster Project:
Step 1:
A) A huge oil rig explosion happened in April 20th, 2010 called the Deepwater Horizon Explosion. It was a disaster. Watch this video and write a summary of what you learned.
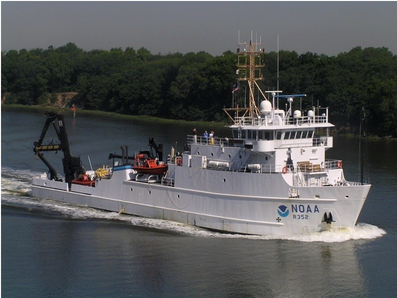
B) The NOAA Nancy Foster (seen above) took a two week long cruise as part of the response to the Deepwater Horizon blowout in 2010. On June 17, 2010 the ship's remotely operated vehicle (ROV) collected a wide variety of data from waters in the Gulf of Mexico. Click on the this link and write a brief description of the Nancy Foster.
Step 2: Hypotheses: Let’s imagine what happens as an ROV travels from the surface to a depth of 2000 meters. Record a hypothesis (educated guess) about the relationship between each of these as the ROV descends into the depths. For example, what do you think would happen to the amount of each variable (i.e. pressure, temperature, salinity, etc.) as the ROV moves deeper in the water.
A. Depth and pressure
B. Depth and temperature
C. Depth and salinity
D. Depth and density
E. Depth and amount of oxygen
F. Depth and the amount of chlorophyll (chlorophyll is an indication of the amount of phytoplankton)
Step 3: Open and make a copy of the Nancy Foster Data (Click Here) collected on June 17th for the different conditions per depth. The first row of the spreadsheet identifies the type of data in each column. What do the numbers mean?
Steps 4 - 9: Graph the data! Steps on how to graph each variable is shown below using pressure as an example. A picture of the pressure graph is also included to help you format your graphs. In total, you should create six different graphs since there are six conditions (pressure, temperature, salinity, density, oxygen, and chlorophyll). You will be taking screenshots of each graph and uploading in performance task. You will also analyze the graphs and answer questions.
A) A huge oil rig explosion happened in April 20th, 2010 called the Deepwater Horizon Explosion. It was a disaster. Watch this video and write a summary of what you learned.
B) The NOAA Nancy Foster (seen above) took a two week long cruise as part of the response to the Deepwater Horizon blowout in 2010. On June 17, 2010 the ship's remotely operated vehicle (ROV) collected a wide variety of data from waters in the Gulf of Mexico. Click on the this link and write a brief description of the Nancy Foster.
Step 2: Hypotheses: Let’s imagine what happens as an ROV travels from the surface to a depth of 2000 meters. Record a hypothesis (educated guess) about the relationship between each of these as the ROV descends into the depths. For example, what do you think would happen to the amount of each variable (i.e. pressure, temperature, salinity, etc.) as the ROV moves deeper in the water.
A. Depth and pressure
B. Depth and temperature
C. Depth and salinity
D. Depth and density
E. Depth and amount of oxygen
F. Depth and the amount of chlorophyll (chlorophyll is an indication of the amount of phytoplankton)
Step 3: Open and make a copy of the Nancy Foster Data (Click Here) collected on June 17th for the different conditions per depth. The first row of the spreadsheet identifies the type of data in each column. What do the numbers mean?
Steps 4 - 9: Graph the data! Steps on how to graph each variable is shown below using pressure as an example. A picture of the pressure graph is also included to help you format your graphs. In total, you should create six different graphs since there are six conditions (pressure, temperature, salinity, density, oxygen, and chlorophyll). You will be taking screenshots of each graph and uploading in performance task. You will also analyze the graphs and answer questions.
- Click on J to highlight the Depth column.
- Go to “insert” chart and a chart will appear.
- Make sure the chart is a line graph. If it’s not, select this option.
- In the Chart Editor box on the right, click “Add X-axis” and then click on the “select a data range”, which is the table icon to the right of the magnifying glass.
- In the “Select a data range” field, type the pressure data range, which is B1:B2001. You will need to adjust the letter for each condition (e.g. temperature, chlorophyll, ect.), but the numbers following the letter (1 and 2001) will remain the same for each. For instance, to graph temperature you would type A1:A2001 in this field.
- Add chart titles by clicking on the customize option in the chart editor. You only need to add the Chart Title (Pressure per Depth) and Horizontal Axis (Pressure (dbar) Title. The vertical axis should already be labeled Depth (m) for you. If it’s not add this title too. Once again, the chart titles will change depending on what condition you are graphing (e.g. temperature, chlorophyll, etc.). Don’t forget to add units to your condition on the horizontal title! For instance, you can’t just put Depth and Pressure on the vertical and horizontal axis without adding (m) and (dbar), respectively.
- Customize the grid lines and ticks by clicking on the boxes titled major and minor grid lines.
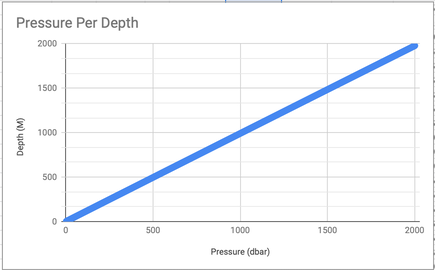
Step 4: Pressure
A) Insert photo of graph in performance task.
B) What is the observed relationship between pressure and depth?
Step 5: Temperature
A) Insert photo of graph in performance task.
B) Describe the relationship between temperature and depth. Please notice that the relationship is not linear! Did if fall in line with your hypothesis?
Step 6: Salinity
A) Insert photo of graph in performance task.
B) Describe the relationship between salinity and depth. This relationship is complicated. Do your best to explain what is going on with salinity as it relates to depth. Did it fall in line with your hypothesis?
Step 7: Water Density
A) Insert Photo of graph in performance task.
B) Describe the observed relationship between water density and depth. Do your best to explain this relationship, keeping in mind that density is a combination of two factors temperature and salinity. Did it fall in line with your hypothesis?
Step 8: Oxygen (Note: Graph column N)
A) Insert photo of graph in performance task.
B) Describe the observed relationship between oxygen and depth. The ocean, in most places, has a layer known as the oxygen minimum zone, at what depth do you see the oxygen minimum zone? Did it fall in line with your hypothesis?
Step 9: Chlorophyll (Note: leave units blank on graph)
A) Insert photo of graph in performance task.
B) Describe the observed relationship between chlorophyll and depth. Do you notice a “spike” in the data, why is that where it is? Did it fall in line with your hypothesis?
Step 10: The epipelagic - Look back through your graphs and describe what the epipelagic zone (0-200 m) is like, describing each of the six variables.
Step 11: The Mesopelagic - Look back through your graphs and describe what the mesopelagic zone (200-1000 m) is like, describing each of the six variables.
Step 12: The Bathypelagic - Look back through your graphs and describe what the mesopelagic zone (1000-4000 m) is like, describing each of the six variables.
Step 13: Research the Deepwater Horizon Oil Head Blowout of 2010. What was the impact of this environmental disaster on the Gulf of Mexico.
A) Insert photo of graph in performance task.
B) What is the observed relationship between pressure and depth?
Step 5: Temperature
A) Insert photo of graph in performance task.
B) Describe the relationship between temperature and depth. Please notice that the relationship is not linear! Did if fall in line with your hypothesis?
Step 6: Salinity
A) Insert photo of graph in performance task.
B) Describe the relationship between salinity and depth. This relationship is complicated. Do your best to explain what is going on with salinity as it relates to depth. Did it fall in line with your hypothesis?
Step 7: Water Density
A) Insert Photo of graph in performance task.
B) Describe the observed relationship between water density and depth. Do your best to explain this relationship, keeping in mind that density is a combination of two factors temperature and salinity. Did it fall in line with your hypothesis?
Step 8: Oxygen (Note: Graph column N)
A) Insert photo of graph in performance task.
B) Describe the observed relationship between oxygen and depth. The ocean, in most places, has a layer known as the oxygen minimum zone, at what depth do you see the oxygen minimum zone? Did it fall in line with your hypothesis?
Step 9: Chlorophyll (Note: leave units blank on graph)
A) Insert photo of graph in performance task.
B) Describe the observed relationship between chlorophyll and depth. Do you notice a “spike” in the data, why is that where it is? Did it fall in line with your hypothesis?
Step 10: The epipelagic - Look back through your graphs and describe what the epipelagic zone (0-200 m) is like, describing each of the six variables.
Step 11: The Mesopelagic - Look back through your graphs and describe what the mesopelagic zone (200-1000 m) is like, describing each of the six variables.
Step 12: The Bathypelagic - Look back through your graphs and describe what the mesopelagic zone (1000-4000 m) is like, describing each of the six variables.
Step 13: Research the Deepwater Horizon Oil Head Blowout of 2010. What was the impact of this environmental disaster on the Gulf of Mexico.
