Bathymetry Project:
Part A: Topography is the study of the elevation of terrain on land. Watch this video on Topography (click here) and then answer the questions to each step below.
Step 1:
1. What is topography?
2. What is the primary goal of topography?
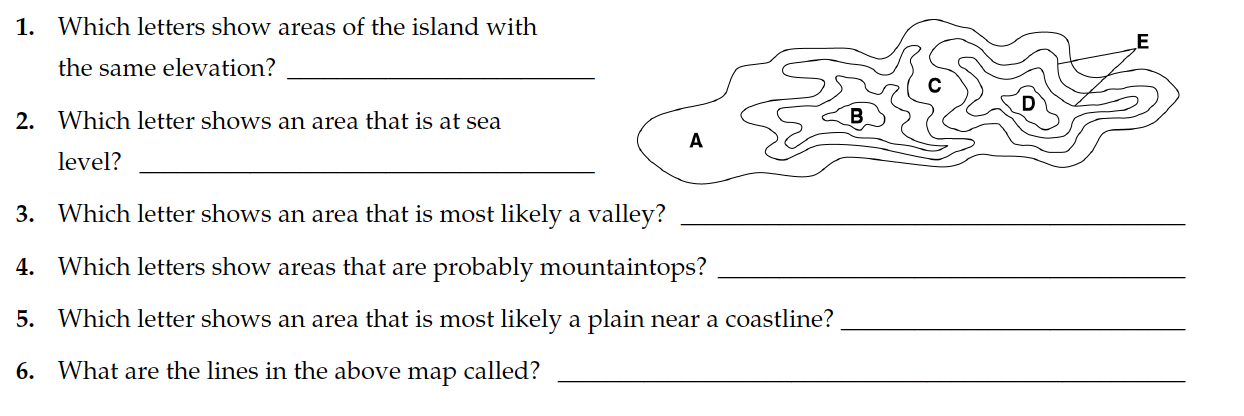
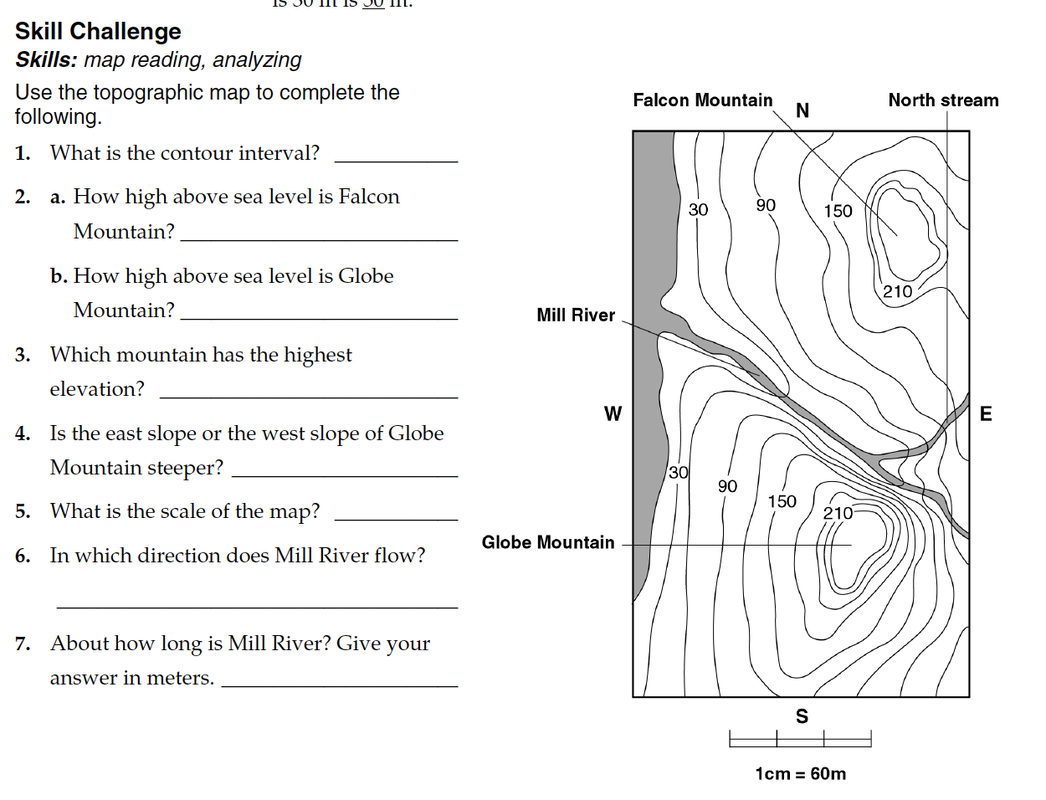
3. What do topography maps show you?
4. What are contour lines?
5. What does the spacing between contour lines on a topographic map tell you?
Step 2: Answer the questions below in your performance task.
Part A: Topography is the study of the elevation of terrain on land. Watch this video on Topography (click here) and then answer the questions to each step below.
Step 1:
1. What is topography?
2. What is the primary goal of topography?
3. What do topography maps show you?
4. What are contour lines?
5. What does the spacing between contour lines on a topographic map tell you?
Step 2: Answer the questions below in your performance task.
Step 3: Answer the questions below in your performance task.
Part B: On ocean basin is any seafloor covered by seawater. Bathymetry is the process of measuring the elevation of the seafloor or ocean depths. As on land, the ocean floor will undulate (i.e. change in depth or elevation) depending on what ocean feature is found directly underneath. For instance, ocean trenches will show greater ocean depths than an underwater volcano. This is because the underwater volcano will be at a higher elevation. Read this Bathymetry History article (click here) to learn how scientists have studied bathymetry over time and then answer the questions below in your performance task.
1. What's an oceanographer's term for bathymetry?
2. How is the role of an oceanographer similar to cartographer?
3. Describe how bathymetry was measured before electronics and what were the drawbacks of this method?
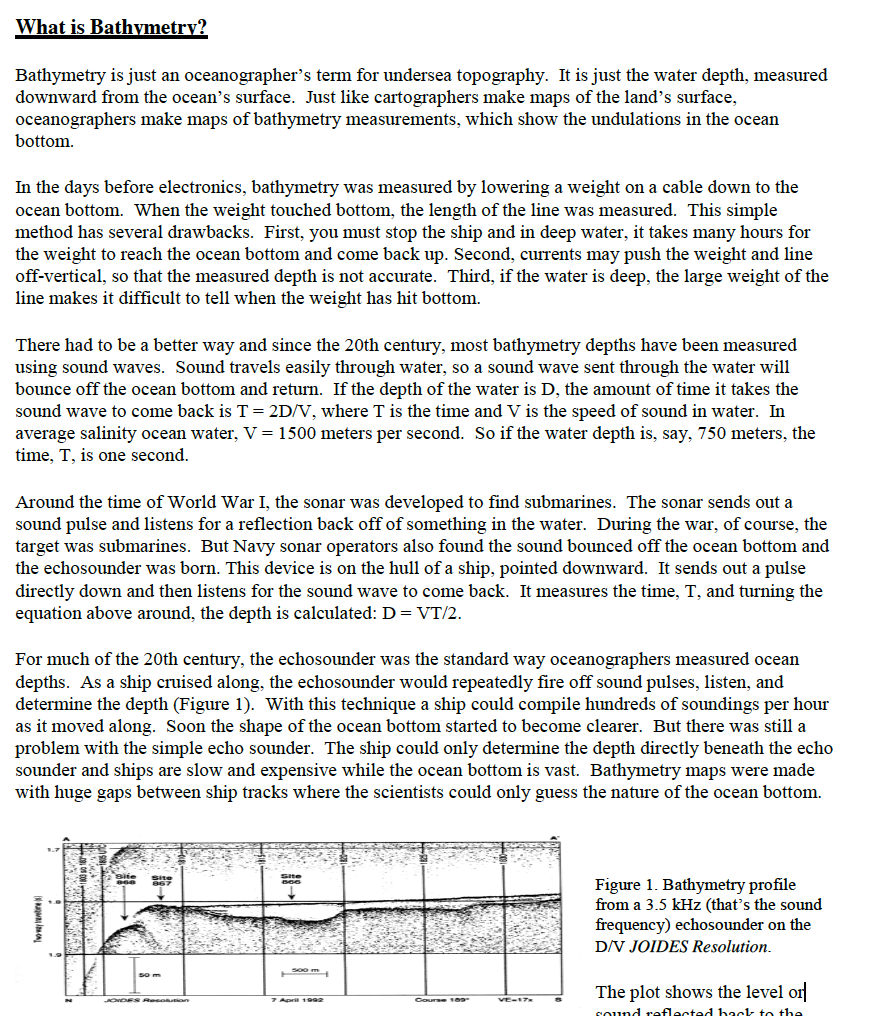
4. In the 20th century, describe what scientists used to measure bathymetry and how does this method work?
5. If velocity of sound waves in normal seawater is 1500 meters per second, calculate the time it took the sound wave to come back to the boat at a depth of 500o meters.
6. What bathymetry method was developed around World War I and how does this method work?
7. What was the advantage of charting the ocean floor with an echosounder?
Part C: Watch the Bathymetry video (click here) and write 10 facts that you learned in your performance task.
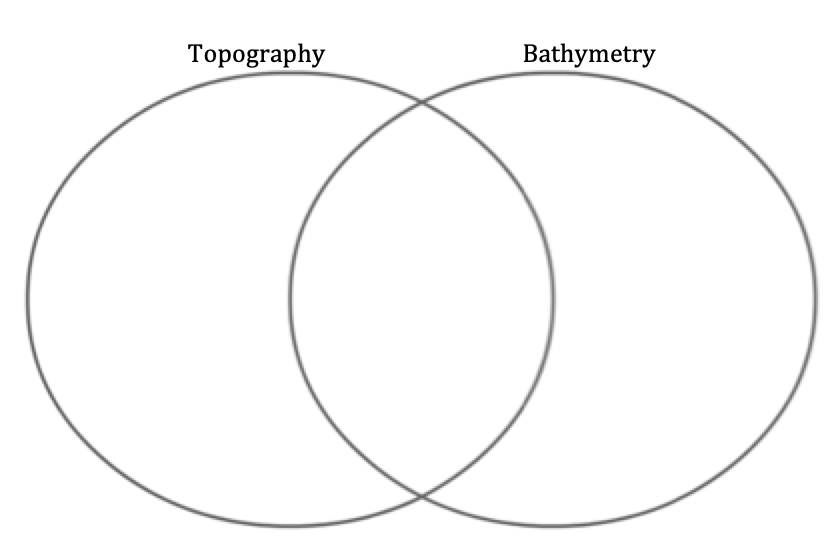
Part D: Using the information you have learned thus far and also reading this additional article (click here), describe the similarities and differences of bathymetry and topography in a Venn Diagram. Copy the model pictured below on a sheet of paper and write in 3 characteristics in each section. Once finished, take photo of work and upload in performance task. Shrink down to a reasonable size.
1. What's an oceanographer's term for bathymetry?
2. How is the role of an oceanographer similar to cartographer?
3. Describe how bathymetry was measured before electronics and what were the drawbacks of this method?
4. In the 20th century, describe what scientists used to measure bathymetry and how does this method work?
5. If velocity of sound waves in normal seawater is 1500 meters per second, calculate the time it took the sound wave to come back to the boat at a depth of 500o meters.
6. What bathymetry method was developed around World War I and how does this method work?
7. What was the advantage of charting the ocean floor with an echosounder?
Part C: Watch the Bathymetry video (click here) and write 10 facts that you learned in your performance task.
Part D: Using the information you have learned thus far and also reading this additional article (click here), describe the similarities and differences of bathymetry and topography in a Venn Diagram. Copy the model pictured below on a sheet of paper and write in 3 characteristics in each section. Once finished, take photo of work and upload in performance task. Shrink down to a reasonable size.
Part E: Obtain the Bathymetry Fathoms Map template from your teacher. You can also print it out (click here). A fathom is a unit of length equivalent to 6 ft of water depth. So a fathom of 1 would indicate the water is 6 feet deep in that location. A fathom of 2 would indicate the water is 12 feet deep. A fathom of 54 would indicate the water is 324 ft deep. In this part, you will be looking at the seafloor depth around Santa Barbara ocean basin. Remember, an ocean basin is any area that is covered by ocean water. Using the key on the right side of your template, color in a different color for each fathom interval. Afterward, color in the contour lines on the map with the color that represents the fathom level it falls in. Some of the numbers are difficult to read. Just find a number within the contour that is readable and shade it in the whole contour level with the corresponding fathom color. If necessary, ask the teacher for a magnifying glass to enlarge the numbers. Once finished coloring, obtain a Label Tags template from your teacher. You can also print one out (click here). Cut out each tag as close to the lettering as you can. Try not leaving too much space around the edges of the label so it will fit on your bathymetry fathoms map. Glue the tags where each feature is located on your Bathymetry Fathoms Map. Once finished glueing, take photo of completed work and upload in performance task. Shrink down to a reasonable size.
